
Not knowing where your benefits package stands against competitors is a blindspot and a liability.
You may believe your programs stack up, but without real benchmarking data you’re running on assumptions.
Competitors who measure, compare, and adjust are gaining an edge, often in ways you can’t see until talent is already walking out the door.
Employee satisfaction doesn’t collapse overnight; it erodes quietly. Packages built on guesswork miss what workers actually value, leaving them vulnerable to offers that feel more relevant elsewhere. Every month without clear benchmarks increases the risk that your spend is wasted, your retention weakens, and your reputation as an employer of choice slips.
Employee benefits benchmarking isn’t about vanity metrics or checking boxes. It’s the process that shows whether your investments are paying off, whether employees are staying engaged, and whether you’re losing ground in the race for talent. Without it, you’re competing blind.
Comparing your benefits packages shows you what truly resonates with today's workforce. Automated debt optimization surpasses wellness apps in its effectiveness.
Your benefits package either alleviates genuine financial stress or it doesn't. We will guide you through the process of comparing against what truly matters to today's workforce.
Key Takeaways
- Traditional benefits benchmarking misses the mark when 78% of workers struggle with debt
- Financial wellness tools outperform standard perks in talent retention
- Modern workforce data from 80 countries reveals shifting priorities toward debt management
- Competitive packages now require automated debt optimization features
- Real comparisons on solving employee financial stress, not matching averages
- Companies winning the talent war address paycheck-to-paycheck living through benefits
Why Your HR Department Should Benchmark Benefits
Smart HR departments leverage benefit reviews to prevent wastage on perks that go unnoticed. They make decisions that impact millions annually. Without robust data, they risk budget mismanagement and employee dissatisfaction.
The harsh truth is that 78% of employees live paycheck to paycheck. Financial strain erodes productivity and increases turnover rates. Despite this, many companies invest in benefits that fail to address these fundamental issues. A thorough benefits analysis uncovers these discrepancies swiftly.
Move away from speculating on what your employees want, and deliver what they actually need. You'll find that the cost of your employee benefits drop, and your package becomes more used.
Employee benefits benchmarking is not only about cost control. Studies show that well-structured benefits directly boost satisfaction and contribute to stronger business performance.
Smart benchmarking confers three significant benefits:
- Better allocation of benefits budget based on actual employee needs
- Improved retention rates through targeted financial stress reduction
- Higher productivity from employees with better financial wellness
National research confirms that employers who adopt financial wellness benefits see stronger employee engagement, improved retention, and lower turnover
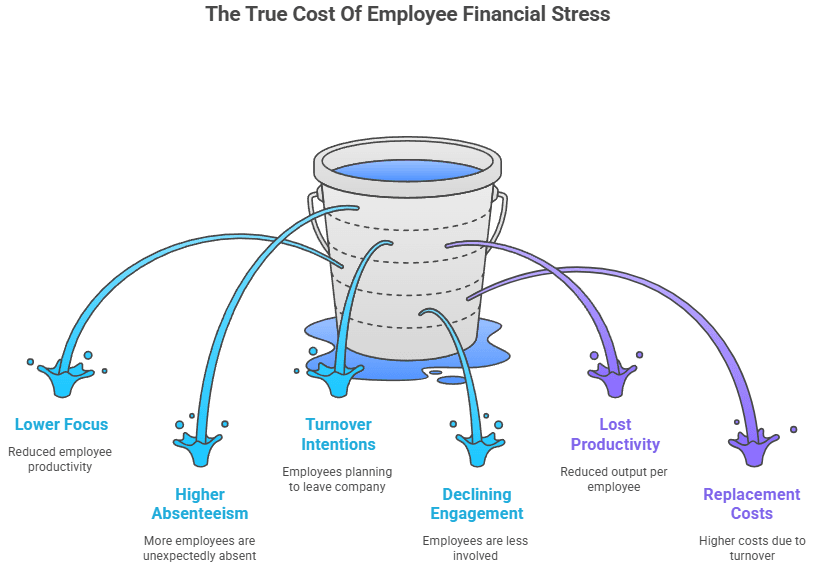
The outcome? Enhanced benefits at reduced costs, coupled with increased employee satisfaction. Your HR team evolves from a mere cost center to a strategic asset. You transition from mindlessly addressing problems to solving them with precision.
Why Competitive Benefits Need Debt Optimization
HR teams that evaluates benefits cut waste, plan costs better, and stay focused on what actually helps employees. Guesswork inflates your spend and masks gaps. Hard data changes that.
Financial stress hits 78% of your workforce. It affects focus, increases absenteeism, and drives attrition. If your benefit stack doesn’t address that, expect productivity losses near $3,000 per employee each year.
Reviewing your perks helps you align your offerings with what people actually use. Harvard research emphasizes that pay and benefit benchmarking are central to retaining talent and staying competitive.
Debt management tools are becoming a key part of that stack. They don’t educate, they act. By automating loan monitoring and refinancing, they directly reduce interest payments and improve mental health. That’s how you calculate the ROI of your HR efforts.
If your current vendor isn’t offering this level of proactive savings, it’s time to find one that does. Apriority makes debt optimization automatic, unbiased, and built to serve employees.
Now tie that to benefits that solve real problems. Use your next assessment cycle to flag low-value perks and plug in support where it's missing, especially around financial wellness.
Smart assessments meet specific goals: higher retention, stronger productivity, and a benefits plan built for the actual lives your people are living.
Step 1: Define Objectives and Metrics
Without clear goals, your employee benefits benchmark is merely a time-consuming exercise. It's essential to have specific objectives before collecting data. You'll link employee satisfaction to tangible business outcomes.
Your objectives should address real challenges. HR metrics like cost per employee are important. Yet, metrics that measure financial stress reduction are more critical. The ideal comparison assesses both aspects.
Begin with these fundamental questions:
- What business problems are you solving? High turnover, low engagement, or productivity issues
- Which employee groups need attention? New hires, remote workers, or specific demographics
- What budget constraints exist? Total compensation limits or specific benefit categories
- How will you measure success? ROI through retention, engagement scores, or productivity gains
Identifying KPIs for Effectiveness
Effective KPIs measure real impact on your workforce. Traditional metrics, such as utilization rates and cost per employee, reveal what employees use. They fail to show what employees need.
Modern KPIs focus on outcomes:
- Employee retention rates - Track turnover before and after benefit changes
- Financial wellness indicators - Measure stress reduction through debt optimization tools
- Engagement scores - Monitor workplace focus and productivity improvements
- Benefits satisfaction ratings - Use your benefits survey for employees to track perception changes
- Time-to-fill positions - Better benefits attract candidates faster
Include emerging benefit categories in your KPIs. Debt management solutions reduce financial stress. Mental health resources improve workplace focus. These benefits deliver measurable ROI through reduced absenteeism and higher productivity.
USI's study tracks plan design, contributions, demographics, and usage patterns. Your KPIs should capture similar data points. This ensures benchmarking consistency across organizations.
Setting Realistic Goals and Timelines
Quality data takes time to gather and analyze properly. Rushing the process is counterproductive. Most effective studies run quarterly with annual reviews.
Your timeline should include these phases:
- Month 1-2: Define objectives and identify peer companies
- Month 3-4: Collect internal and external data
- Month 5-6: Analyze gaps and develop action plans
Set realistic expectations for change. Benefits improvements take 12-18 months to show measurable impact. Employee behavior changes slowly. Financial wellness programs need time to reduce stress levels.
Your goals should be specific and measurable. Instead of "improve benefits," aim for "reduce turnover by 15% within 18 months." Instead of "better work-life balance," target "increase PTO utilization by 25%."
Remember, your report is not solely about competitive positioning. It's about solving real problems that deliver measurable business value.

Step 2: Gather Comprehensive Data on Your Current Benefits Strategy
Collecting data on your current employee benefits strategy is the first step to smarter decisions. Without a full picture, personalization is impossible, costs spiral, and programs miss the mark.
Start by cataloging health benefits, retirement contributions, paid time policies, and insurance coverage. Pull cost data, usage stats, and feedback scores into one place. That’s your baseline.
Next, map perks like wellness programs, learning stipends, and flexible work options. Include actual uptake. You’ll often find strong benefits that go unused, and critical ones that are missing.
Don’t forget financial wellness. Tools that address debt, not just budgeting, deliver measurable returns. Their absence drags down engagement and drives employee attrition.
Family and scheduling benefits matter too. Document parental leave, childcare support, and work-from-anywhere options. Tech stipends count.
Every line in your spreadsheet is a potential decision point. With enough data collected, you stop guessing and start aligning benefits to business goals.
HR teams that track this closely retain top talent, control plan costs, and gain a competitive edge. Your benefits advisor can’t deliver value without it.
Better data drives better decisions. Start with what you have, then compare the best.
Step 3: Identify Your Peer Companies and Industry Standards
Benchmarking only works if you're comparing against companies that match your talent needs. The small business benefits package of a 50-person firm won’t gain much insight from measuring against a 10,000-person enterprise. Misalignment distorts data and weakens decision-making.
Start with three filters: company size, location, and industry. Each one affects benefit costs, participation, and expectations. Use them to build a relevant peer group.

Companies of similar size face similar constraints. A business with 50 employees manages plan costs differently than one with 1,000. Grouping by size clarifies what’s realistic for your stage.
Geography drives benefit competitiveness. Cost of living in San Francisco demands different compensation than Kansas City. Local talent markets shift what employees expect.
Industry alignment brings focus. Tech, manufacturing, healthcare, and finance each prioritize different employee benefits. Health programs, paid time policies, and fringe benefits vary widely.
Expand beyond direct competitors. Look at regional employers and benefit leaders in other sectors. Companies already using automated debt management are gaining a competitive edge by addressing real stress drivers.
Study the data collected from associations, published surveys, and industry reports. Learn which perks drive satisfaction and which benefits reduce turnover. This is how you stay ahead of the competition.
The benefits of this analysis shows up in recruiting, retention, and overall business efficiency. Done right, this process makes your employee benefits package more valuable, without increasing cost.
Step 4: Collect External Data Through Multiple Sources
You'll need to check data from various reliable sources to create a thorough understanding. Relying solely on one survey or report is insufficient for making informed decisions about your benefits package. The most effective total rewards assessment strategies integrate professional surveys, government data, and industry-specific research. This combination validates findings and identifies emerging trends.
Collecting quality data is a time-consuming endeavor but is essential for making informed decisions. By cross-referencing data from different sources, you can identify patterns and confirm your findings. This method prevents costly errors due to incomplete or outdated information.
Leveraging Professional Benefits Surveys
Professional benefits surveys provide the most detailed and actionable data. The USI Benefits Benchmarking Study is a leading resource, analyzing data from thousands of employers across various industries. It examines hundreds of data points, including costs, utilization rates, and employee demographics.
The Benepass guide offers valuable insights into contemporary benefits trends and employee preferences. These surveys capture real-world data, enabling you to understand what similar companies actually offer, not just what they claim.
Seek surveys that include emerging benefits categories in their analysis. Financial wellness and debt management tools are rapidly growing but might not be covered in older surveys. Forward-thinking studies capture these trends, enabling you to stay ahead of employee compensation standards.
Professional surveys typically provide:
- Detailed cost breakdowns by benefit category
- Utilization rates across different employee groups
- Regional and industry-specific variations
- Emerging benefits adoption rates
Utilizing Government and Industry Reports
Government sources offer broader industry trends and regulatory insights, complementing professional surveys. The Bureau of Labor Statistics publishes extensive benefits data across industries and regions, providing a solid baseline for your total rewards assessment.
These reports offer insights into macro-level trends affecting benefits costs and employee expectations. Government data also provides context for regulatory changes that might impact your benefits strategy.

Industry associations conduct specialized surveys for their sectors, providing targeted insights not found elsewhere. These reports often include detailed analysis of benefits challenges specific to your industry, such as healthcare costs in manufacturing or retention issues in technology.
Key government and industry sources include:
- Bureau of Labor Statistics Employee Benefits Survey
- Department of Labor benefits compliance data
- Industry association compensation studies
- Regional economic development reports
Remember to include financial wellness metrics in your data collection efforts. Traditional surveys might overlook these emerging benefits, but they are critical components of employee compensation. Seek studies that measure employee financial stress and the impact of debt optimization tools on retention and productivity.
Step 5: Analyze Healthcare and Insurance Benefits Against Market Norms
Medical insurance is your largest benefits expenditure, necessitating precise comparison for financial health. It typically accounts for 60-70% of your total benefits budget.
Forward-thinking organizations extend their analysis beyond mere coverage comparisons. They scrutinize the interplay between healthcare costs and employee financial stress. Medical debt exacerbates existing financial woes for those already burdened by loans and credit cards.

Your assessment should focus on three essential areas. First, compare your medical, dental, and vision coverage against industry standards. Next, dissect cost-sharing models and employee contributions. Lastly, assess the breadth of provider networks and the flexibility of your plans.
Comparing Coverage Options and Cost-Sharing Models
Begin by detailing your current plan configurations. Document deductibles, copays, and out-of-pocket maximums for each category. Then, compare these figures against market data from peer companies.
High-deductible health plans may initially appear cost-effective but can induce significant financial strain on employees. Those earning $50,000 annually often face $3,000 deductibles. Such financial pressures can erode productivity and job satisfaction.
Examine employee premium contributions with great care. The average worker contributes 28% of premium costs for family coverage. If your rates exceed 30%, you risk losing talent to competitors with more favorable cost-sharing models.
Consider the broader impact of healthcare costs on employee wellbeing. Some organizations find that aiding employees in managing their debt offers greater value than incremental improvements to health plans. Your benefits audit must assess the total financial impact, not solely medical coverage.
Evaluating Provider Networks and Plan Flexibility
Network size and quality are more critical than premium costs for many employees. They value access to specialists and preferred hospitals. While narrow networks may save money, they can also lead to employee dissatisfaction due to loss of preferred doctors.
Assess plan flexibility through various perspectives. Can employees choose between HMO, PPO, and high-deductible options? Do you offer Health Savings Accounts or Flexible Spending Accounts? These options empower employees to better manage healthcare expenses.
The ultimate goal is to foster overall employee wellbeing, not just medical coverage. Assess how healthcare benefits complement financial wellness programs. Organizations that address both health and financial stress experience enhanced employee retention and engagement.
Step 6: Benchmark Retirement and Financial Security Benefits
Don't overlook what is an often overlooked yet critical success factor: whether employees can afford to contribute to their 401k.
Even the most generous 401k match is irrelevant if employees lack the financial means to participate.
The financial reality is stark. Employees burdened with 18% interest on credit cards cannot afford to contribute to retirement accounts yielding 7% returns. This scenario results in a net loss on every dollar saved, explaining the low 401k participation rates despite competitive matching.
Adopting a smart strategy involves incorporating financial wellness tools to address the root cause. By eliminating high-interest debt first, employees gain the financial capacity to contribute to retirement. This approach leads to higher participation rates and enhanced long-term financial security for your workforce.
Assessing 401k Matching and Vesting Schedules
Consider comparing key retirement plan elements against industry standards:
- Matching formulas: Most companies offer 50% to 100% match on the first 3-6% of employee contributions
- Vesting schedules: Immediate vesting versus graded schedules over 2-6 years
- Contribution limits: Whether you allow catch-up contributions for employees over 50
- Investment options: Number of funds, expense ratios, and target-date fund availability
Yet, don't merely focus on plan design features. The true benchmark metric is participation rates by salary level. Low participation among high earners often signals tax compliance issues. In contrast, low participation among lower earners typically reveals cash flow problems that retirement benefits alone cannot solve.

Regularly track these utilization metrics. Compare your participation rates against similar companies in your industry and region. If your rates lag behind, despite competitive matching, the issue likely lies outside your retirement plan.
Retirement planning is only effective when debt isn’t in the way. That’s why companies seeing the highest participation rates start with tools like Apriority. Let’s talk about integrating it into your benefits portfolio.
Evaluating Financial Wellness and Debt Management Solutions
Forward-thinking companies extend their benefit analysis to include financial wellness programs. These programs address the barriers preventing retirement plan participation.
Modern financial wellness solutions include:
- Automated debt optimization: Tools that continuously monitor for better rates and refinancing opportunities
- Paycheck allocation guidance: Systems that help employees prioritize high-interest debt elimination
- Financial education resources: Training that explains why debt reduction enables retirement savings
- Emergency savings programs: Short-term savings options that prevent new debt accumulation
When comparing these benefits, focus on measurable outcomes. Seek solutions that demonstrate increased 401k participation rates after debt reduction. The best programs show a clear progression: employees eliminate high-interest debt, then automatically increase retirement contributions.
You should compare total financial security offerings, not just traditional retirement plans. Companies that combine debt optimization with retirement benefits see participation rates 40-60% higher than those with 401k plans alone.
Step 7: Evaluate Work-Life Balance and Flexible Benefits
Flexible employee benefits only work when people can afford to use them. Unlimited PTO and remote work lose value under financial stress. That’s why your analysis must include how financial wellness affects benefit usage.
Start with your current PTO policies and remote work rules. Measure accrual rates, rollover limits, and schedule flexibility against your peer group. Then look deeper. If you offer generous paid time but see low utilization, check the financial context. Employees living paycheck to paycheck skip days off, even when they’re sick.
Compare against companies combining flexible work with financial wellness benefits. Their PTO usage rates are often 40% higher. That means more rested teams, fewer workplace burnout cases, and better employee health.
Family-focused programs carry high expectations and high costs. Track paid parental leave, dependent care support, elder care resources, and fertility benefits. Compare coverage limits, usage rates, and out-of-pocket burdens.
Cost of employee benefits matters, but so does engagement. If employees can’t use what’s offered, the value drops.

Add debt support to family-friendly plans. Employees free from high-interest payments are more likely to take leave, access support, and engage with corporate wellness ideas.
Track usage, satisfaction, and financial wellness indicators across every category, including disability coverage and employee incentives. That’s how competitive benefits are built.
Step 8: Measure Employee Satisfaction and Utilization Rates
At this stage, your process feels nearly complete. But the final stretch matters most. Now’s when data turns into action, and your report starts delivering real returns.
Employee satisfaction surveys paired with usage data show which benefits actually support your team. This is your evaluation phase. Look past costs and measure how each program impacts retention, productivity, and financial stress.
Compare usage rates with satisfaction scores. Flag underperforming programs, especially those with high costs and low engagement. This step improves your capabilities and prevents waste.
Calculate the true cost of employee benefits. Include administration, time spent by HR, and employee effort. Then measure ROI through reduced turnover, fewer sick days, and higher engagement. Financial wellness benefits often lead the pack here.

Use your total rewards data to spot hidden gaps. Look for supplemental benefits that align with employee needs, not just trends.
Group health coverage matters, but so does solving for debt, burnout, and job satisfaction.
This is where smart companies stay ahead of the competition. They make fact-based decisions, align benefits with employee reality, and adjust fast.
Your next move? Put the data to work, your workforce is watching.
Measuring Success: Ongoing Benchmarking and Continuous Improvement
A strong benefits package needs constant tuning. Just like debt tools monitor for better rates, your report should track real-time value.
Run quarterly reviews to catch shifts early. Focus on usage, cost per employee, and satisfaction. Run a deeper evaluation once a year to check your benefits against industry standards.
High-impact categories like group health or financial wellness deserve monthly check-ins. Watch how benefits perform, not just what they cost.
Demographics shift. So do expectations. Survey employees twice a year. Ask what’s working, what’s missing, and what they actually use.
New benefit types show up fast. Stay current on financial wellness benefits, flexible work needs, and supplemental support. Keep your capabilities sharp.
Make fact-based decisions. Run with data. That’s how your benefits decisions stay competitive.
See how Apriority can be an addition to your benefits package that keeps you competitive.
FAQ
How often should we conduct employee benefits benchmarking?
Perform quarterly reviews to gauge utilization and satisfaction. Conduct an annual analysis against market standards. Employee needs evolve with economic shifts and demographic changes. Regular competitive analysis keeps your benefits competitive and relevant. View it as an ongoing process, not a one-time task.
What's the biggest mistake companies make when comparing benefits?
They focus on traditional benefits while neglecting financial wellness. Most compare health insurance and 401k matching but overlook debt stress. This creates a significant gap between offered benefits and actual employee needs. Including emerging solutions like debt optimization tools addresses real workplace issues.
How do we choose the right peer companies for benefits comparison?
Select organizations with similar size, industry, and geographic location. A 50-person startup shouldn't compare with Fortune 500 packages. Include companies known for innovative benefits, like financial wellness programs. Validate your comparison group by cross-checking multiple sources.
What metrics should we track beyond traditional benefits utilization?
Monitor financial stress reduction, productivity gains, and retention rates. Track engagement scores and workplace focus indicators. Include ROI calculations to show how benefits reduce turnover costs. Evaluations reveals which benefits solve real problems versus those tolerated by employees.
Why should debt management be part of our benefits assessment?
Financial stress impacts work performance and retention. Employees with high-interest debt can't afford retirement contributions. Debt optimization tools free up cash for other benefits while reducing stress. Companies with robust financial wellness offerings attract top talent.
How do we calculate the true cost of our benefits package?
Include administration fees, vendor costs, HR time, and technology expenses. Factor in employee time spent on benefits management and opportunity costs of unused programs. Measure ROI through retention improvements, as replacing an employee costs 50-200% of their salary. Total rewards assessment requires a detailed cost analysis.
What data sources provide the most reliable benchmarking information?
Use multiple sources like USI's Benefits Benchmarking Study, Bureau of Labor Statistics reports, and industry association research. Cross-reference findings to identify patterns and validate data. Don't rely on single sources. Include emerging benefits categories that represent growing trends.
How do we identify gaps in our current benefits offerings?
Compare utilization rates against satisfaction scores to spot underperforming categories. Conduct employee benefits surveys focusing on financial stress and unmet needs. High-cost benefits with low satisfaction need attention. Look for patterns in employee feedback about missing support, such as financial wellness and debt management.
What's the ROI of implementing financial wellness benefits?
Companies see improvements in retention, productivity, and employee engagement. Reduced financial stress correlates with better job performance and lower turnover. Employees with optimized debt show better focus at work and higher utilization of other benefits. The ROI often exceeds traditional benefits because these tools address root causes of workplace stress.
How do we prioritize benefits improvements after reporting?
Focus on high-impact, low-cost improvements first. Financial wellness tools often deliver significant employee value without major budget increases. Create realistic implementation timelines allowing 3-6 months for major additions. Set success metrics before implementation and communicate changes effectively to employees. The goal is systematic improvement that delivers measurable results.
Should we analyze companies outside our industry?
Yes, but selectively. While industry-specific comparisons matter for core benefits, innovative companies across sectors often lead in emerging areas like financial wellness. Study organizations known for exceptional employee benefits regardless of industry. These forward-thinking employers provide insights into trends that could give you competitive advantage in talent acquisition.
How do we measure employee satisfaction with our benefits package?
Conduct regular employee benefits surveys with specific questions about utilization, satisfaction, and unmet needs. Ask directly about financial stress and its impact on work performance. Analyze usage data for patterns between satisfaction and utilization. Cross-reference satisfaction data with retention and productivity metrics to identify benefits that create real value.