
The cost of doing business is rising.
High inflation, talent shortages, shifting employee expectations, ESG obligations, customers demanding more for less… Business owners are left pulling their hair out.
For many HR leaders, that means the mandate is clear: find more value, with fewer dollars. One of the biggest, and most scrutinized, line items?
Employee benefits costs. U.S. companies spend an average of $26,980 per year on benefits per employee, with healthcare and retirement taking the lion’s share. These are non, negotiables, but they’re also expensive.
And with limited budget room, HR teams are left asking: Are we getting the return we need from these investments?
The answer starts by reframing how we evaluate benefits.
Instead of just asking “How much does this cost?”, it’s time to ask, “How much does this return?”
In this article, we’ll explore: -How much companies are really spending on benefits. -What “employee benefit ROI” actually looks like -How non, traditional offerings like debt optimization stretch your benefit dollar. -What data to use when building a stronger, smarter employee benefits strategy
Let’s break down the real value behind the benefits line item, and how to maximize it.
What Is the Average Cost of Employee Benefits Today?
Employee benefits are often viewed as a fixed cost, but the truth is, they vary significantly depending on company size, workforce demographics, and industry norms.
Understanding where your spend falls compared to national averages is essential for smart planning and better ROI.
Breaking Down the Average Cost of Benefits Per Employee
According to the U.S. Bureau of Labor Statistics, U.S. employers spend an average of $13.49 per hour on employee benefits.
That adds up to about $26,980 annually per full, time employee, accounting for approximately 30% of total employee compensation.
This includes: -Health insurance -Retirement, savings, life insurance -Paid leave and supplemental pay -Legally required benefits (Social Security, Medicare, unemployment)
Health and retirement make up the majority of the spend.
How Benefits Costs Vary by Business Size and Industry
Small business benefits typically cost more per employee due to the limited bargaining power and lack of scale compared to enterprise employers. They also carry higher administrative costs relative to headcount.

In contrast, large companies often benefit from bulk pricing, in, house HR teams, and access to lower, risk insurance pools, helping them contain costs.
Industry also matters: -Tech and finance tend to offer richer benefits (often 40, 45% of salary) with various employee incentives. -Retail and hospitality usually stay closer to the minimum required offerings (under 25% of salary). -Healthcare and education fall somewhere in the middle but are influenced heavily by union agreements and public funding.
Demographics also influence cost: -Older or more tenured workers tend to use more healthcare and retirement benefits. -Workforces with more dependents increase healthcare premiums significantly.
Understanding these cost variables isn’t just about comparison, it’s about control. Clear benchmarking helps you make more strategic choices: where to invest, where to contain costs, and how to communicate total compensation more effectively.
The Big Four: Medical, Retirement, Dental, and Vision
Understanding the distinct costs and value of each key benefit helps HR leaders manage the biggest buckets of their total cost and spend.
Here’s a breakdown of the "Big Four", and why each deserves attention:
Medical (Health Insurance)
-Average cost per employee: Around $7,911 annually for single coverage and $22,463 for family insurance coverage; employers typically cover ~$6,584 (individual) to ~$16,357 (family) -Why it varies by state: Medical insurance premiums differ significantly by geography. Rural vs metropolitan areas, state regulations, and provider networks all play a role.
What this means for HR: -Medical accounts for ~50, 60% of total benefit spend. -State, level variation means HRs need to pay special attention to benchmarking in each local market and be very strategic with vendor negotiations.
Retirement (401k, Pensions, Savings)
-Typical employer contribution: Around 5-10% of salary, translating to $2,800, $5,600/year/full, time employee. -Variation by workforce: Tenured or older employees often receive higher matching percentages, raising costs.

What this means for HR: -Retirement is a long, term investment in loyalty. -Comparing plan generosity and matching strategy with industry peers can guide optimization.
Dental
-Average employer cost: Approximately $8.94, $13.90 / month, or $107, $167/year / employee. -Cost drivers: Choice between DPPO, DHMO, and fee, for, service plans; self-insurance vs fully insured models
What this means for HR: Dental is a low, cost, high, impact benefit, often as a “must, have”. It strengthens cohesion in your benefit package while keeping per, employee costs under control.
Vision
-Although less data is publicly available, vision benefits typically cost less than $5, $10/month/employee. -Employer contributions vary widely, often depending on plan type and demographic risk.
What this means for HR: -Vision is a modest investment with outsized goodwill. -Can be offered as a voluntary or employee, paid benefit to minimize budget impact.
State and Workforce Variation
-State, level differences: Employers in costlier regions (e.g., Northeast, West Coast) typically pay 20, 30% more for health and vision benefits.
How Can Small Business Owners Budget for Employee Benefits?
Creating a sustainable and competitive benefits program starts with a clear budgeting strategy. One that aligns with benchmarks and stretches every dollar. Here’s a refined approach:
1. Allocate a Target Percentage of Payroll
-Guidelines suggest allocating 15, 20% of total compensation package toward benefits as a starting point for small businesses. -Small, business employers often pay about 30% in benefits, relative to per hour wages, consistently with private, industry average.
2. Use Small, Business Specific Benchmarking
-Small businesses (≤50 employees) averaged $12,299 / employee / year for health plans, including employer + employee contributions. -That figure rose ~7% year, over, year, highlighting the importance of annual budget reviews.
3. Account for Hidden and Variable Costs
Health premiums are just the start. Additional costs may include: -Administration fees, payroll taxes, compliance obligations -Volatility from ERISA, deductibles, or changes in employee demographics -Market, driven premium hikes of 6, 10% or more annually
4. Plan for Scale and Changes
-As companies grow, per employee rates drop due to bulk purchasing and access to better group plans. -But new hires may introduce higher, cost demographics, especially older employees or those with dependents.

5. Leverage Strategic Partnerships
-Join a PEO to consolidate services and access group discounts. -Use HRAs or ICHRAs to manage employee out, of, pocket costs. -Reassess alternative plans each year to balance generosity with cost control.
6. Explore Non, Mandatory Benefits Such as Debt Optimization
-Non, mandatory benefits can help stretch the benefits budget as they are typically low cost and high impact. -Debt Optimization services for employees have been proven to improve retention and employee engagement in companies of all sizes. A balanced benefits program enables you to control costs while maximizing impact, setting the stage for innovative, lower, cost solutions like debt optimization.

If you're looking to expand your benefits offering without expanding your budget, solutions like debt optimization are a smart place to start.
Contact Apriority to learn how our employee debt optimization services can help you improve retention, reduce financial stress, and get more ROI from every dollar you spend on benefits.
How Much Do Benefits Grow Company Earnings?
Most HR teams know the cost of each benefit line item. But strategic HR teams measure how much value they create per dollar spent.
Here's how that ROI shows up:
-Retention Impact: It costs an average of six to nine months of an employee’s salary to replace them. Reducing voluntary turnover by just 10% (from the national average of 18% down to 8%) in a 100, person company (at a $50K average salary) can save $250,000 / year in avoided recruiting and onboarding costs.
-Productivity Boost: Financial stress is linked to a 34% drop in workplace productivity. Even modest reductions, say, a 10% productivity lift for a $60K salaried employee, can yield $6,000 / employee / year in regained output. Across 100 employees, that’s** $600,000 in recovered productivity**.
-Recruiting Efficiency: If better benefits shorten time, to fill by just 5 days and reduce agency or job board spend by $500 per hire, a company filling 50 roles annually could save $25,000 or more on recruiting costs alone.
To capture this ROI, you must link benefit spend to measurable business outcomes: -Compare turnover rates before and after a benefit rollout. -Measure engagement, productivity, or absenteeism data tied to specific offerings. -Report benefit utilization rates alongside cost and projected savings.
This positions HR to build a portfolio that grows earnings through retention, efficiency, and employee well being.
Employee Benefits Cost: ROI Tracking
Measuring the success of your benefits program requires more than tracking costs, it demands a framework for evaluating return.
Yet many HR teams lack access to expensive analytics tools.
Fortunately, with the right metrics and formulas, it’s possible to benchmark and evaluate ROI using data you likely already have.
Start with Core ROI Metrics:
Use the formulas below to quantify the impact of your benefits program:
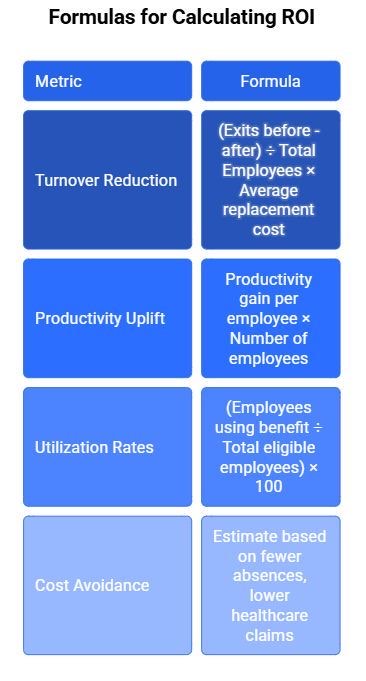
Practical Formulas:
-Benefit ROI Formula = (Total Value Gained - Total Benefit Cost) ÷ Total Benefit Cost × 100 -Perks Cost, Efficiency = Annual Benefit Cost per Employee ÷ (Retention Gain or Productivity Hours Gained)
Benchmark Tools to Use:
- Bureau of Labor Statistics (BLS) for national cost averages.
- KFF Health Benefits Survey for healthcare, specific data.
- SHRM and PwC Reports for retention, stress, and productivity metrics.
Internal Tools That Cost Nothing:
- Payroll and HRIS platforms to track cost and utilization.
- Exit interviews to understand why employees leave.
- Pulse surveys to gauge satisfaction and perceived benefit value. Pro Tip: Use a spreadsheet to compare each benefit against these 3 values: -Cost per employee -Usage rate -Impact on a key outcome (such as retention or engagement) Score each item and rank them. This creates a live heatmap of benefit package effectiveness. And a business case for removing or scaling specific programs.

High, Impact Low, Cost Benefits That Stretch Your Budget
Some of the most effective programs are those that cost the least, because they target urgent, under, addressed pain points.
Why Programs Like Debt Optimization Punch Above Their Weight
Debt optimization tackles one of the biggest and most invisible stressors in the modern workforce: personal debt.
With 78% of Americans living paycheck to paycheck, helping employees lower their loan costs directly improves financial wellness.

It indirectly boosts productivity, retention, and morale.
Key advantages:
- Low cost to employers: Unlike health or retirement plans, debt optimization requires no per, employee match or ongoing claims.
- High utilization: Employees are far more likely to act on a benefit that results in real, immediate savings.
- Scalable and automated: Continuous monitoring means HR doesn’t need to manually administer or update the benefit.
Benchmarks for Affordable High, ROI Perks
These programs prove that strategic alignment, not budget size, determines benefit impact. When designed to solve real problems, even the smallest investments can generate company, wide returns.
- Debt Optimization: Costs ~$5/employee/month. Provides thousands in annual savings per user; 0.375% lower loan rates.
- Financial Counseling: Costs ~$50, 100/employee/year. Reduced stress, improved credit, fewer absentee days
- Employee Association Program: Costs ~$12, 40/employee/year. Mental health support mitigates crisis intervention.
- Wellness Stipends: Costs ~$100, 500/year. Enhanced engagement, lifestyle alignment
Turning Cost Centers Into Value Drivers
Benefits are a powerful lever for attracting top talent, reducing turnover, and boosting productivity. But to unlock that potential, HR teams need to move beyond traditional budgeting and start thinking like investors.
By applying ROI frameworks, benchmarking smarter, and layering in high-impact, low-cost programs like debt optimization, companies can stretch their budgets without compromising value. The goal isn’t to spend less, it’s to spend better.
Whether you manage a 20, person team or a 2,000, person workforce, the same principle applies: every benefit should earn its place. Use data and formulas. Use feedback.
And above all: use strategy.
The future of employee benefits isn’t just cheaper. It’s more intentional, more effective, and more aligned with what employees really need.
When every dollar counts, the right benefits strategy can make all the difference. Apriority helps HR teams unlock more value from their budgets with low-cost, high-impact solutions like employee debt optimization.
Contact us to start building a smarter, more strategic benefits program.